Ouroboros Metrics: Difference between revisions
| Line 89: | Line 89: | ||
== Variables == | == Variables == | ||
[[File: Grafana_variables.png|border|frameless|none|Variables in the grafana dashboard]] | [[File: Grafana_variables.png|500px|border|frameless|none|Variables in the grafana dashboard]] | ||
At the top, you can set a number of variables to restrict what is seen on the dashboard: | At the top, you can set a number of variables to restrict what is seen on the dashboard: | ||
Revision as of 10:47, 21 July 2024
![]() This page is under construction
This page is under construction
A collection of observability tools for exporting and visualising metrics collected from Ouroboros.
Currently has one very simple exporter for InfluxDB, and provides additional visualization via grafana.
More features will be added over time.
Requirements
See also the step-by-step instructions for the python dependencies, including using a virtual environment.
- Ouroboros version >= 0.18.3
- InfluxDB OSS 2.0
- python influxdb-client, install via
pip install 'influxdb-client[ciso]' - And you might also need pytz:
pip install pytz - It is highly recommended to install grafana for visualization.
Setup InfluxDB
Install and run InfluxDB and create a bucket in InfluxDB for exporting Ouroboros metrics, and an API token for (reading and) writing to that bucket. Consult the InfluxDB documentation on how to do this. The default bucket name for the exporter is ouroboros-metrics, and it is simplest to use that name.
Set up Grafana
To use grafana, install and run grafana open source.
Go to the grafana UI (usually http://localhost:3000) and set up InfluxDB as your datasource: Go to Configuration -> Datasources -> Add datasource and select InfluxDB Set “flux” as the Query Language, and under “InfluxDB Details” set your Organization as in InfluxDB and set the copy/paste an API token for reading the bucket to the Token field.
To add the Ouroboros dashboard, select Dashboards -> Manage -> Import
and then either upload the json file from the metrics repository in
dashboards-grafana/general.json
or copy the contents of that file to the “Import via panel json” textbox and click “Load”.
The dashboard in the repository assumes the bucket name to be ouroboros-metrics, and will require editing if you want to use a different bucket name.
Step by step instructions
On each of the machines running O7s, install the exporter
git clone https://ouroboros.rocks/git/ouroboros-metrics
cd ouroboros-metrics
cd exporters-influxdb/pyExporter/
It is common to create a virtual environment for Python and install the dependencies
python -m venv ./venv
source venv/bin/activate
pip install --upgrade pip
pip install influxdb_client[ciso] pytz
Edit the config.ini.example file and fill out the InfluxDB information (token, org). This file will be identical on all machines.
[influx2]
url=http://<IP address of machine running InfluxDB>:8086
org=<your-org>
token=<your-token>
timeout=6000
verify_ssl=False
Save it as config.ini.
Now you can run the exporter:
python oexport.py
Options for the exporter can be shown using
$ python oexport.py --help
usage: oexport.py [-h] [-i INTERVAL] [-b BUCKET]

Ouroboros InfluxDB metrics exporter

options:
  -h, --help            show this help message and exit
  -i INTERVAL, --interval INTERVAL
                        Interval at which to collect metrics (milliseconds)
  -b BUCKET, --bucket BUCKET
                        InfluxDB bucket to write to
For instance, if you chose a different InfluxDB bucket name, run the exporter using the --bucket <yourbucketname> option.
Dashboard
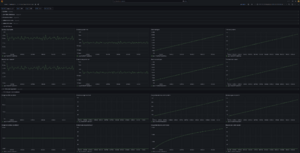
The grafana dashboard allows you to explore various aspects of Ouroboros running on your local or remote systems. As the prototype matures, more and more metrics will become available.
Variables
At the top, you can set a number of variables to restrict what is seen on the dashboard:
- System allows you to specify a set of host/node/devices in the network. The list will contain all hosts that put metrics in the InfluxDB database in the last 5 days. Unfortunaly there seems to be no current option to restrict this to the current selected time range.
- Type allows you to select metrics for a certain IPCP type.
- Layer allows you to restrict the metrics to a certain layer
- IPCP allows to restrict metrics to a certain IPCP
- Interval allows to select a window in which metrics are aggregated. Metrics will be aggregated from the actual exporter values (e.g. mean or last value) that fall in this interval. This interval should thus be larger than the exporter interval to ensure that each window has enough raw data.

